Study the charts given below carefully and answer the question that follows.…

2021

Study the charts given below carefully and answer the question that follows. The pie chart shows the percentage distribution of the total students (Science + Commerce) of class 12 across five different zones, and the table shows the number of Science students of class 12 in the same zones.
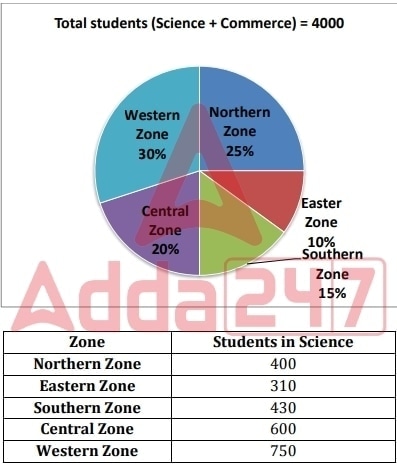
Pie chart of zone-wise percentage distribution and a table of Science students per zone

Find the ratio of the number of Science students in the Western Zone to the number of Commerce students in the Eastern Zone.

Answer: E. 25 : 3ConceptIn a pie chart, each zone's share of a fixed total gives that zone's total head-count: zone total = (zone percentage) × (grand total). Within a zone,…

  1. A.

    7 : 1

  2. B.

    22 : 9

  3. C.

    21 : 8

  4. D.

    17 : 5

  5. E.

    25 : 3

Attempted by 1 students.

Show answer & explanation

Correct answer: E

Concept

In a pie chart, each zone's share of a fixed total gives that zone's total head-count: zone total = (zone percentage) × (grand total). Within a zone, the two streams add up to the zone total, so Commerce = (zone total) − (Science). A ratio of two such counts is then reduced by dividing both terms by their greatest common divisor (GCD).

Application

Grand total of students = 4000.

  1. Western Zone total = 30% of 4000 = 1200. The table gives Science = 750, which is the count the question needs from this zone.

  2. Eastern Zone total = 10% of 4000 = 400. The table gives Science = 310, so Commerce = 400 − 310 = 90.

  3. Required ratio = Science (Western) : Commerce (Eastern) = 750 : 90.

  4. Divide both terms by their GCD, 30: 750 ÷ 30 = 25 and 90 ÷ 30 = 3, giving 25 : 3.

Cross-check

Reverse the reduction: 25 × 30 = 750 and 3 × 30 = 90, which restores the original counts, and 750 : 90 indeed reduces to 25 : 3. So the required ratio is 25 : 3.

Explore the full course: Ibps Clerk Csa Prelims

Loading lesson…