The pie chart (i) given below shows the percentage distribution of total…
IBPS · 2023
The pie chart
(i) given below shows the percentage distribution of total people (male + female) who visited five different clubs, and pie chart
(ii) shows the percentage distribution of total males who visited these five clubs. Read the data carefully and answer the question given below.
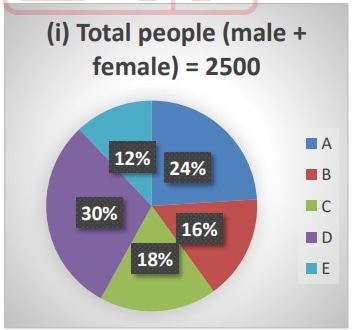
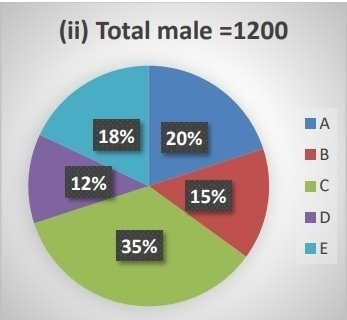
In club C, the ratio of males aged above 25 years to males aged below 25 years is 5 : 3, while in club B the ratio of females aged above 25 years to females aged below 25 years is 1 : 2. If the number of males in C and the number of females in B who are exactly 25 years old are 20 and 40 respectively, then find the sum of the total males in C and the total females in B who are aged below 25 years.
- A.
300
- B.
320
- C.
270
- D.
250
- E.
210
Attempted by 10 students.
Show answer
Correct answer: C