Directions : Given graph shows the number of orders received and cancelled on…
IBPS · 2019
Directions : Given graph shows the number of orders received and cancelled on particular days of a week (From Monday to Saturday) while the table shows the number of orders which were not delivered. Read the data carefully and answer the questions.
(NOTE: Refer Y-Axis values as number of orders while X-Axis values as Days i.e. 20 = Monday, 40 = Tuesday and so on)
(Orders continued/booked are those which are not cancelled)
Some data is missing in the given graph.
Orders Booked = Orders Received – Orders Cancelled
Orders Delivered = Orders Booked – Orders not delivered
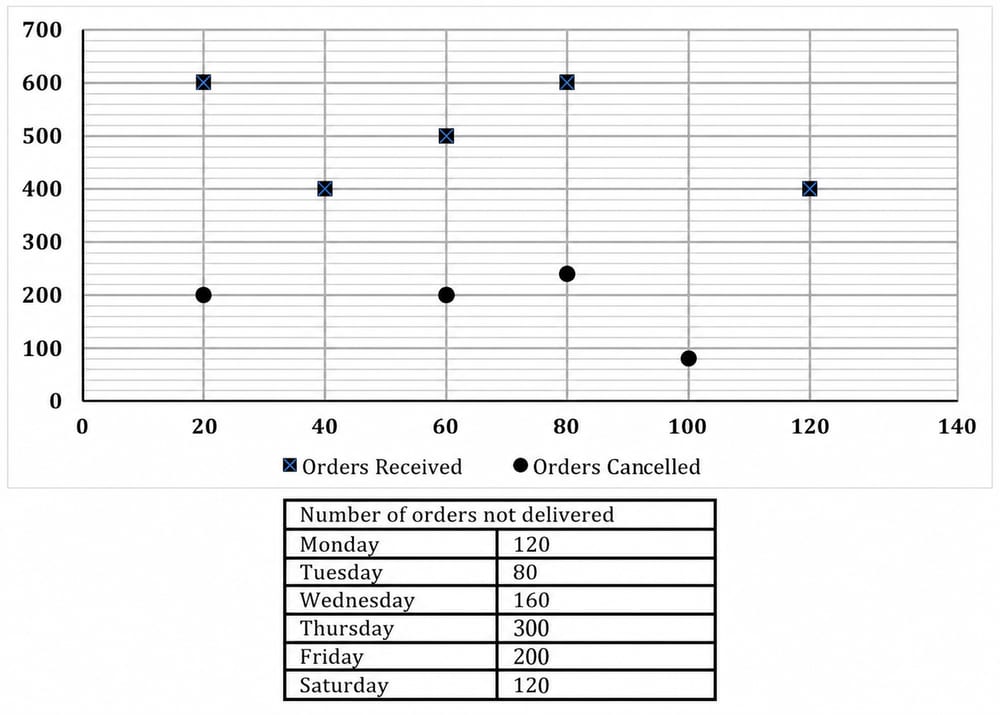
if total orders received on last 3 days are 150 more than total orders received on first 3 days and orders delivered on Friday are more than that on Saturday then what can be the difference between orders cancelled on Saturday and orders delivered on Thursday? (Z > 60)
A. 28 B. 49 C. 23 D. 40 E. 17 F. 37
- A.
A, C, E
- B.
A, C, F
- C.
B, D, F
- D.
all of these
- E.
A, C, D, E, F
Attempted by 3 students.
Show answer
Correct answer: D