Direction: Line graph given below shows percentage of managers out of total…
IBPS · 2020
Direction: Line graph given below shows percentage of managers out of total employees in six (A, B, C, D, E & F) different companies and table shows number of female managers out of total managers in these six companies. Read the data carefully and answer the questions.
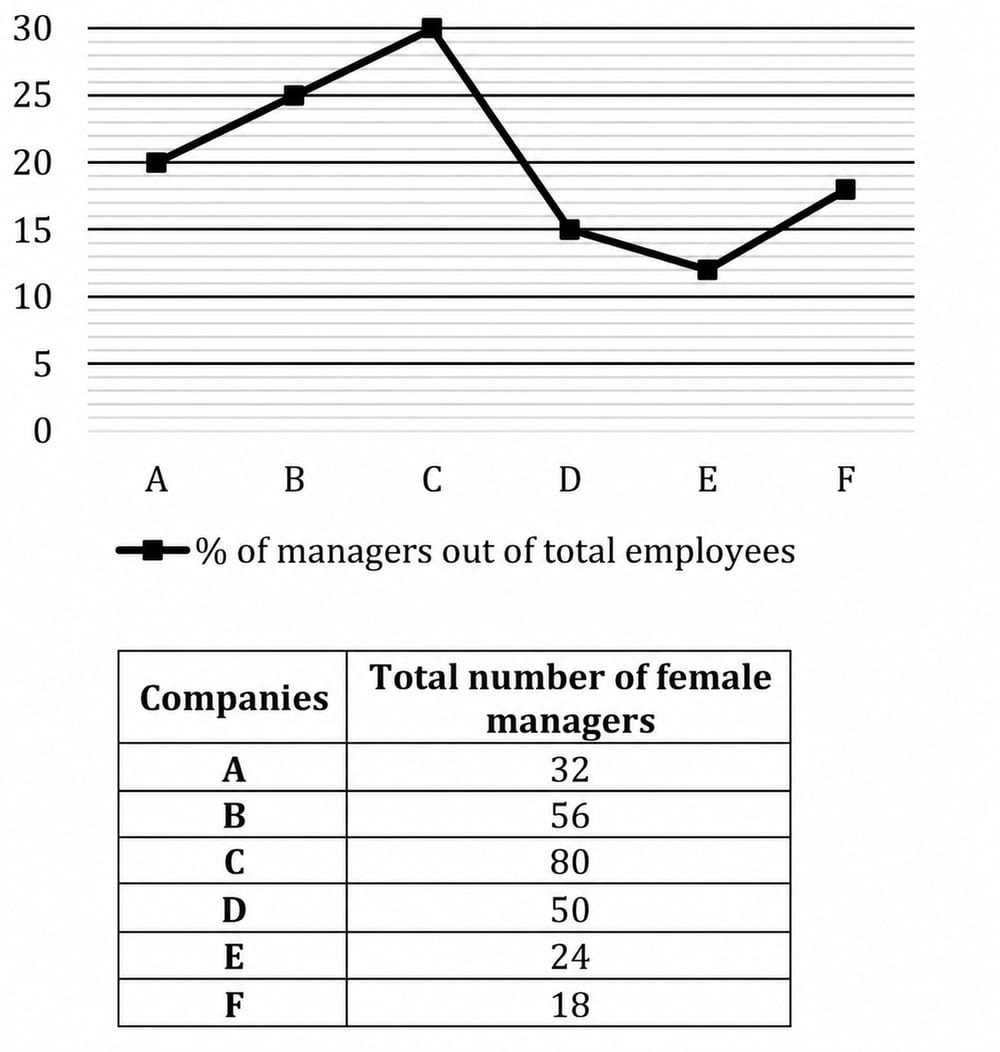
If the total number of male managers in company C is 100 and the total female employee in C is 260, then find the total number of male employee (Non managers + managers) are what percent more than the total number of male managers in company C?
- A.
160%
- B.
280%
- C.
140%
- D.
340%
- E.
240%
Attempted by 10 students.
Show answer
Correct answer: E
Loading lesson…