Directions : Given graph shows the number of orders received and cancelled on…
IBPS · 2019
Directions : Given graph shows the number of orders received and cancelled on particular days of a week (From Monday to Saturday) while the table shows the number of orders which were not delivered. Read the data carefully and answer the questions.
(NOTE: Refer Y-Axis values as number of orders while X-Axis values as Days i.e. 20 = Monday, 40 = Tuesday and so on)
(Orders continued/booked are those which are not cancelled)
Some data is missing in the given graph.
Orders Booked = Orders Received – Orders Cancelled
Orders Delivered = Orders Booked – Orders not delivered
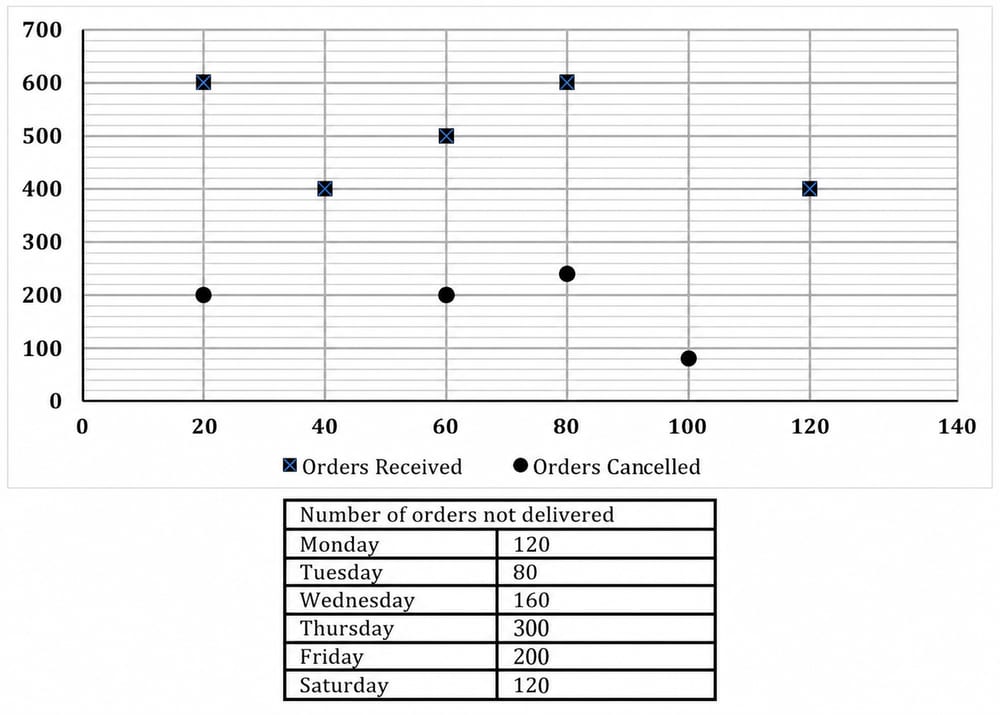
if ratio of orders received on Thursday & Friday together to orders delivered on Monday, Wednesday & Saturday together is 65 : 34 and orders cancelled on Tuesday are 10% less than that on Wednesday and orders cancelled on Saturday is same as difference between orders not delivered on Friday and orders cancelled on Tuesday then how many total orders were booked in these 6 days together?
- A.
2850
- B.
2450
- C.
2280
- D.
None of these
- E.
2170
Attempted by 2 students.
Show answer
Correct answer: C