The bar graph shows the total item manufactured by four companies A, B, C and…
IBPS · 2025
The bar graph shows the total item manufactured by four companies A, B, C and D. It also shows the total item sold by these companies.
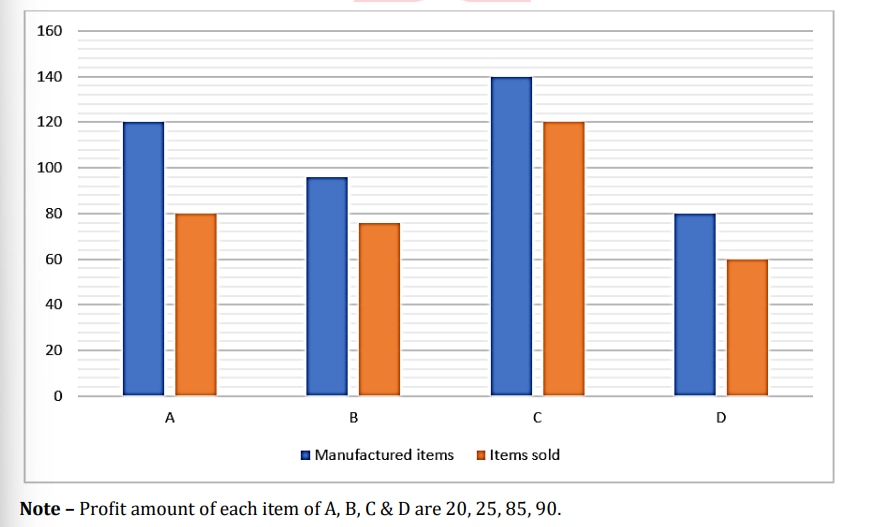
Find the ratio of items sold by A and B together to unsold items of C and D together.
- A.
39:10
- B.
20:19
- C.
40:41
- D.
32:39
- E.
22:21
Attempted by 14 students.
Show answer
Correct answer: A
Loading lesson…