A firm producing air purifiers sold 200 units in 2012. The following pie chart…
GATE · 2014 · EC · Set 4 · General Aptitude
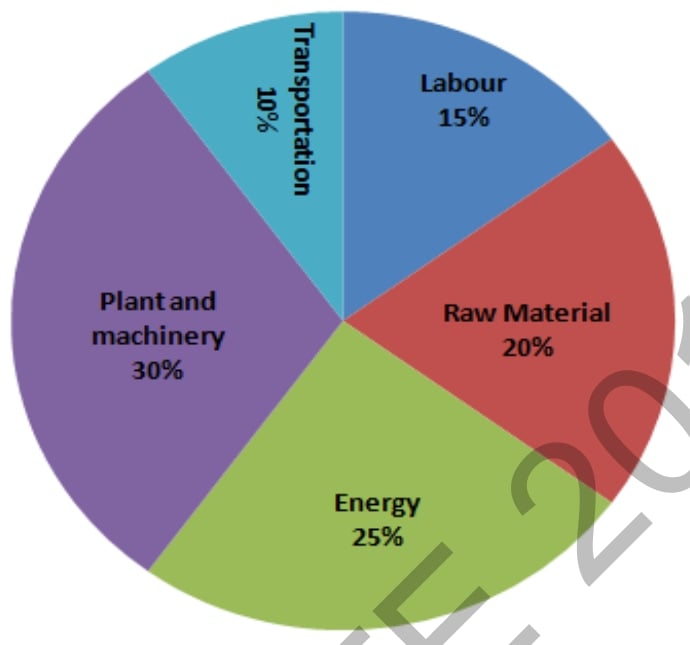
A firm producing air purifiers sold 200 units in 2012. The following pie chart presents the share of
raw material, labour, energy, plant & machinery, and transportation costs in the total manufacturing
cost of the firm in 2012. The expenditure on labour in 2012 is Rs. 4,50,000. In 2013, the raw
material expenses increased by 30% and all other expenses increased by 20%. What is the
percentage increase in total cost for the company in 2013?
Attempted by 2 students.
Sign up free to check your answer
Sign up freeLoading lesson…