

The pie chart presents the percentage contribution of different macronutrients…
PYQ GATE 2024
The pie chart presents the percentage contribution of different macronutrients to a typical 2,000 kcal diet of a person.
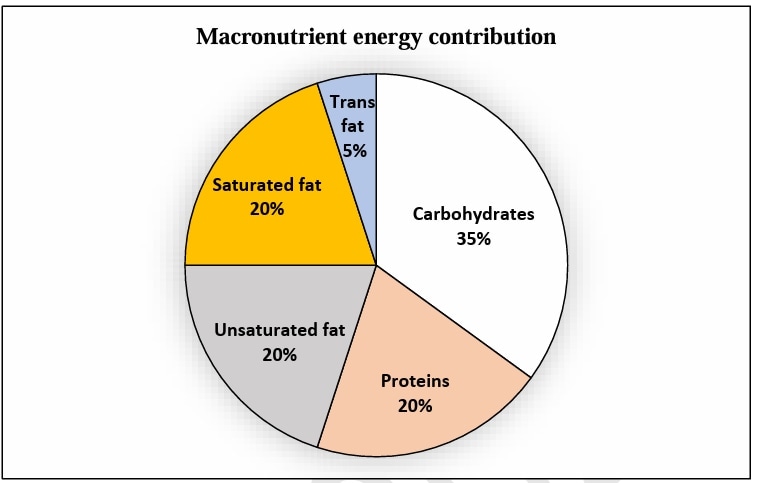
The typical energy density (kcal/g) of these macronutrients is given in the table.
Macronutrient | Energy density (kcal/g) |
|---|---|
Carbohydrates | 4 |
Proteins | 4 |
Unsaturated fat | 9 |
Saturated fat | 9 |
Trans fat | 9 |
The total fat (all three types), in grams, this person consumes is
- A.
44.4
- B.
77.8
- C.
100
- D.
3,600
Attempted by 62 students.
Sign up free to check your answer
Sign up freeLoading lesson…