

The following pie diagram shows information about the crop cultivation for the…
PYQ DSSSB 2018
The following pie diagram shows information about the crop cultivation for the pulses & grains in “XYZ’ state for the year of 2015-2016. Read the information and answer the questions:
The total crop produced in “XYZ” state is 23,428 tonnes.
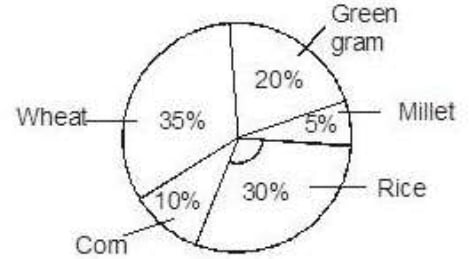
How much crop of green gram is cultivated in ‘XYZ’ city during 2015-16?
- A.
2342.8 tonnes
- B.
4685.6 tonnes
- C.
8185.6 tonnes
- D.
9872.4 tonnes
Attempted by 167 students.
Sign up free to check your answer
Sign up freeLoading lesson…