

Study the given graph and answer the question that follows. The average number…
PYQ DSSSB 2022Modified — slightly modified from the official paper; see the solution
Study the given graph and answer the question that follows.
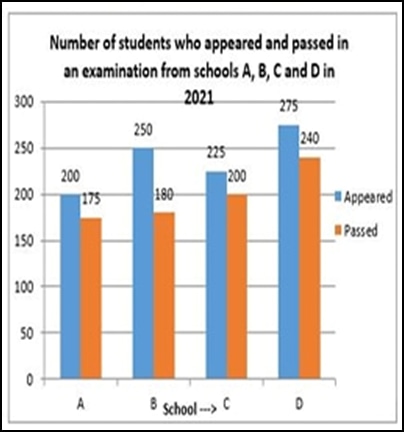
The average number of students (per school) who passed from schools A, C and D is what percentage less than the total number of students who appeared from school B?
- A.
16%
- B.
18%
- C.
21%
- D.
22%
Attempted by 161 students.
Sign up free to check your answer
Sign up freeLoading lesson…