

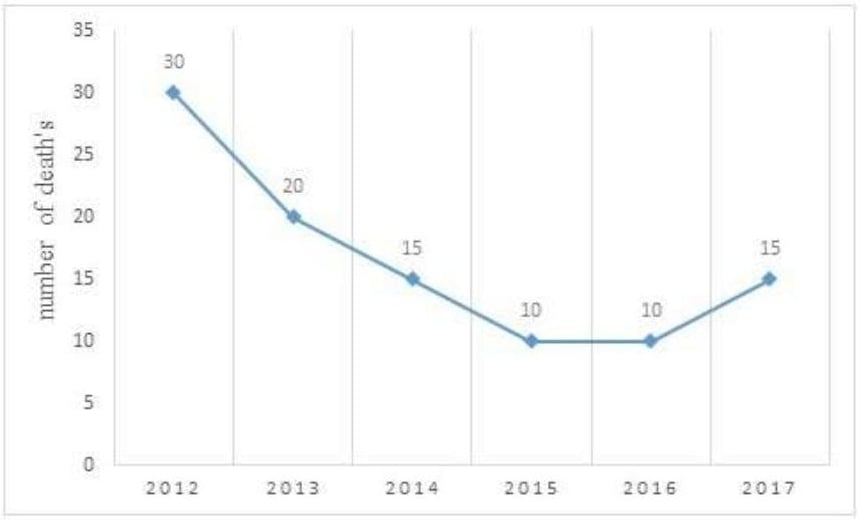
The following graph shows information about the death rate because of dengue…
PYQ DSSSB 2018
The following graph shows information about the death rate because of dengue fever in a tribal village ‘Z’ for the past 6 years. How many people died due to dengue fever in village ‘Z’ during 2015-2017?
- A.
10
- B.
25
- C.
30
- D.
35
Attempted by 325 students.
Sign up free to check your answer
Sign up freeLoading lesson…