

The line chart given below shows the production of 6 companies in 2 years P…
PYQ DSSSB 2024Modified — slightly modified from the official paper; see the solution
The line chart given below shows the production of 6 companies in 2 years P and Q.
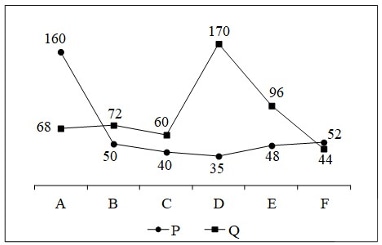
J1 = The total production of all companies in year P. J2 = The total production of all companies in year Q. What is the value of (J2 − J1)?
- A.
125
- B.
100
- C.
150
- D.
85
Attempted by 329 students.
Sign up free to check your answer
Sign up freeLoading lesson…