

The table shows the change in the length of a plant (in cm) during different…
PYQ CTET 2021
The table shows the change in the length of a plant (in cm) during different weeks:
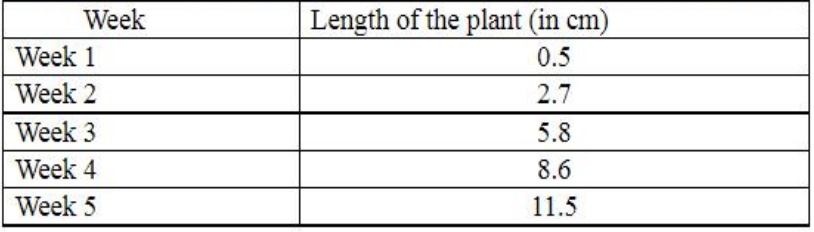
The length of the plant change the most from ____________.
- A.
Week 1 to week 2
- B.
Week 2 to week 3
- C.
Week 3 to week 4
- D.
Week 4 to week 5
Sign up free to check your answer
Sign up freeLoading lesson…