

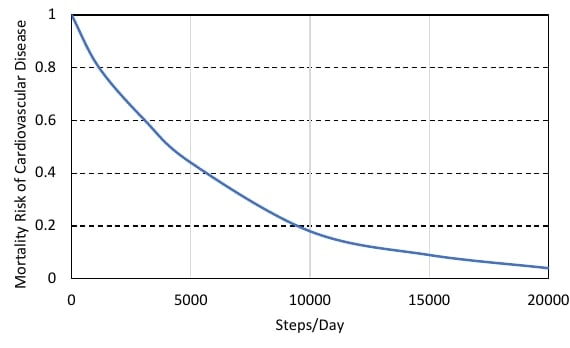
The plot below shows the relationship between the mortality risk of…
PYQ GATE 2024
The plot below shows the relationship between the mortality risk of cardiovascular disease and the number of steps a person walks per day. Based on the data, which one of the following options is true?
- A.
The risk reduction on increasing the steps/day from 0 to 10000 is less than the risk reduction on increasing the steps/day from 10000 to 20000.
- B.
The risk reduction on increasing the steps/day from 0 to 5000 is less than the risk reduction on increasing the steps/day from 15000 to 20000.
- C.
For any 5000 increment in steps/day the largest risk reduction occurs on going from 0 to 5000.
- D.
For any 5000 increment in steps/day the largest risk reduction occurs on going from 15000 to 20000.
Attempted by 11 students.
Sign up free to check your answer
Sign up freeLoading lesson…