

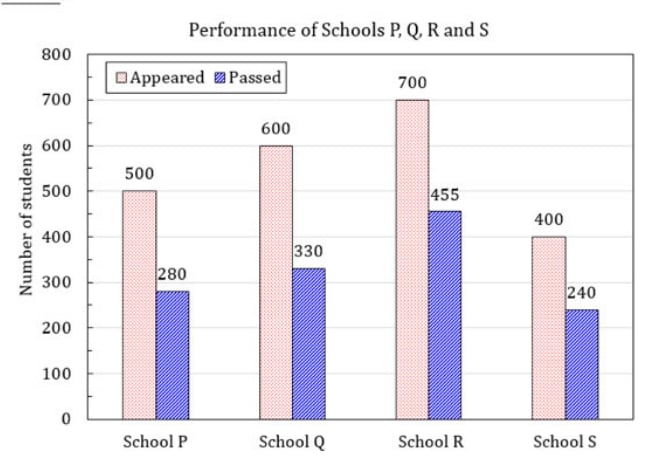
The bar graph shows the data of the students who appeared and passed in an…
PYQ GATE 2020
The bar graph shows the data of the students who appeared and passed in an examination for four schools P, Q, R and S. The average of success rates (in percentage) of these four schools is _____.
- A.
58.5 %
- B.
58.8 %
- C.
59.0 %
- D.
59.3 %
Attempted by 4 students.
Sign up free to check your answer
Sign up freeLoading lesson…