

The following figures show three curves generated using an iterative…
PYQ GATE 2025
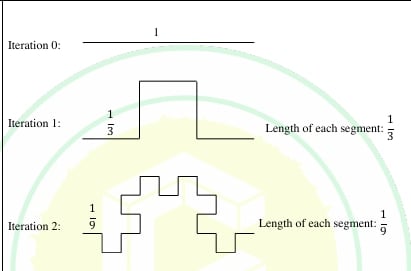
The following figures show three curves generated using an iterative algorithm. The total length of the curve generated after ‘Iteration ’ is:
Note: The figures shown are representative.
- A.
- B.
- C.
- D.
Attempted by 8 students.
Sign up free to check your answer
Sign up freeLoading lesson…